League Table
Widget size: 2 x 1
The League Table widget can handle any type of point. It can be used to display data, such as alarms as traffic lights, status’, costs, totals etc.

Alarms can be included into the table to display the alarm status of the point. Choosing the Alarms option will give the following icons depending on the alarm condition:
- Red icon: High Alarm, Low Fault, High Fault
- Yellow icon: High Alert, Low Alert
- Green icon: OK condition or bespoke status
A way of using the Alarm column for any given point is to choose the Literal display as the reading column and then follow this by the Alarms column to give a colour indication.
Customisation
| Value | Default | Comment |
|---|---|---|
| Widget Heading | League Table | Enter the name of the widget as it is to appear in the heading. |
| Column 0 Heading | Site | Edit the heading of column 0 instead of using the default Site name. |
| Column x Heading (x6) | [Point Name] | Edit the heading of the respective column instead of using the default point name. |
| Column x Display (x6) | Literal | Select display type: Literal (raw value), Traffic Light (red, amber, green), Percentage, Alarms or derived Calc (see later section for explanation). Traffic lights need to have points with output values of 0, 1 and 2. See example section below. |
| Column x Decimal Places (x6) | 0 | Change the number of decimal places to be displayed. |
| Default Sort Column | 0 | Will automatically sort from Column 0, but can be changed to sort from any column by entering its number. |
| Default Sort Order | ASC | Set order to be ASC (ascending) or DESC (descending). |
| Restrict Top Rows | 0 (No Restriction) | Depending on the number of rows in the table, entering a number will restrict the table to that number of rows. |
| Column 0 has Drilldown | True | True or False, to make Column 0 header have a clickable link. If No, then it won't have a link, regardless of what is entered as a drilldown. |
| Column 0 Drilldown | Defaults to dashboard.jsp which allows the user to navigate the whole dashboard to the site showing in the table. | |
| Column x Drilldown (x6) | A drilldown to Multiple Charts or Comparison Chart will take the user to the last 7 days of data irrespective of the date being viewed in the widget. Specify the Comparison Chart URL (comparisonChart.jsp??ignore=me&caller=3) or the Single Charts URL (multipleCharts.jsp??ignore=me&caller=3) | |
| Column x Derived Calc Syntax (x6) | Derived calculations can be created as the results of the column totals rather than the underlying data. For example, C2*C3 or C5/C4 where C=column. Values can only be basic calculations consisting of 2 column references and +, /, -, or *. No numbers can be used. | |
| Column x Aggregation Type (x6) | SUM | AVG/MAX/MIN/SUM/COUNT. These can be effective where you are doing estate level aggregations containing several points. |
| Display All Org Sites | False | False - Display only the sites under the current selection of the dashboard navigation treeview. True - Ignore any site that is passed in by the treeview, and display all data. |
| Hide Column x (x6) | False | Show or Hide Column. |
| Scrollable | No | Yes or No. If Yes is selected, it will activate the scroll period option below. |
| Scroll Period | Year | Scroll through the periods by month or year. |
| Start Month | January | Select the starting month for the table. |
| Site Level | 1 | 0-6, set the level to display the sites from the top of the organization (1 indicates 1 level in from the main organization, and will display all sites under that). |
| Regional Sites | False | False - The default option to show all points within a site as an aggregation for that site. True - Show all points within a site as individual points (rows) within the table. |
| Refresh Period | No widget refresh | Select a refresh period from the drop down menu from between 15 seconds to 1 hour, or no refresh at all |
Derived Calcs can be created as the results of the column totals rather than the underlying data. Using a derived calculation is useful when the league table is aggregating lots of asset or site level data in order to give a region level view, for example to arrive at a KPI of energy cost per m2 for an entire region.
If there is an error in the calculation syntax then you will not be told at design time – the numbers will be returned as -999 at display time. The calculation is not case sensitive.
When using derived calculations, you will need to put in column names (C1, C2, C3, C4, C5, or C6) for that column as the system cannot take a default name from a point.
There are some limitations to using derived calculations at this time: it is not possible to sort on a derived calculation, nor is it possible for a derived calculation to depend on another derived calculations.
Example
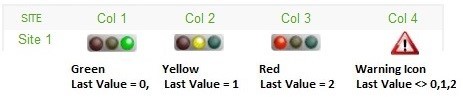
This example shows what is displayed for each "Column x Display" option.
All options use the last value (most recent timetag) stored against the point.
- Literal = the last value
- Derived Calc = simple calculations using values from other columns
- Traffic Lights = works for points where the last value was 0, 1 or 2.
- Percentage = percentage of the total that this row represents. In this example there is only 1 row, so the percentage is 100%.
- Alarms = will display a coloured icon to represent the alarm status of the point.
Col 3 is a Derived Calc and is set to Col1*Col2 (10*5) = 50.